
The module for monitoring charts in separate windows
(“monitoring windows”)
This module is available to members of our MoonBonus program (you can read the terms of participation in this program by clicking on the MoonBonus button at the top of the MoonBot main window).
General settings
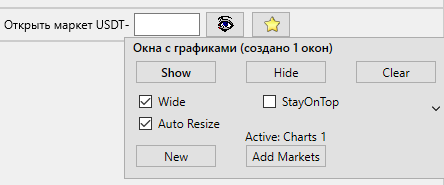
To open the settings, right-click on the “Favorite” button:
Show: show previously created windows with charts
Hide: hide all windows with charts (the state of the windows is remembered after restarting the bot)
Clear: clear and delete all chart windows
The New button adds a new window.
The Add Markets button copies all charts from the main window to the active monitoring window. The window becomes active when you click on it with the mouse; its number is written above the Add Markets button.
The Wide checkbox controls the formation of cells with graphs: without the checkbox, a square table of NxN cells will be built; with a daw, the bot will, if possible, build cells with a ratio of 16: 9
The Auto Resize checkbox controls the automatic recalculation of cells when deleting graphs. If enabled, when manually deleting the graph and, if possible, shortening the table, the cells will be recalculated.
Example: 9 charts were opened in a 3×3 table. You have deleted 3 graphs, there are 6 left. They can be placed in a 3×2 table, with the Auto checkbox the bot will do it automatically. Without the Auto checkbox, the cells are recalculated when the “update” button is pressed (see below)
If you close the window with charts, it does not disappear, you can return it with the Show button. If you close a window without graphs, it is completely deleted.
Checkbox StayOnTop: if enabled, windows with charts will be on top of other windows.
Adding graphs
Graphs can be added manually:
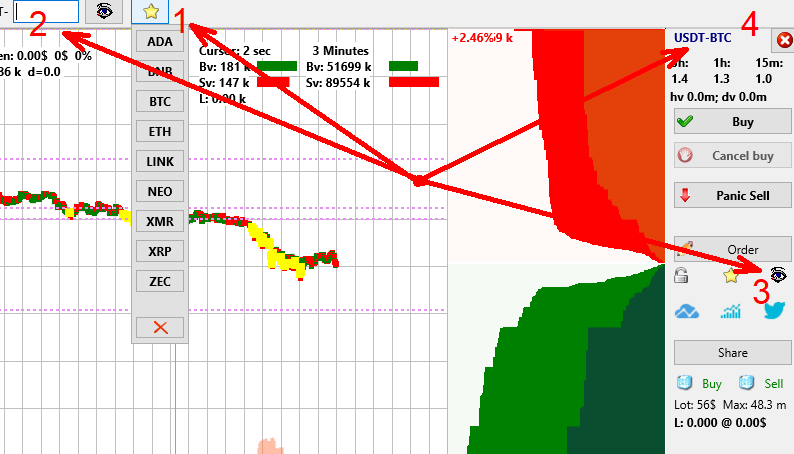
1. using the Favorite button
2. by entering the name of the coin
3. By clicking on the button with the eye to the right of the chart in the main window
4. RMB on the inscription with the name of the market to the right of the chart in the main window
Also, charts can be added automatically upon detection (or upon purchase by MoonShot).
For this, the strategies provide parameters:
AddToChart: Number of the monitoring window, where to add charts
KeepInChart: How many seconds to keep the chart in the window
If the chart is added automatically, the Pin button appears in its upper left corner. If you press it, the chart remains forever, otherwise it is deleted after KeepInChart seconds.
Chart management
The order of the graphs can be changed by dragging the graphs while holding the shift key inside the window, as well as between the windows.
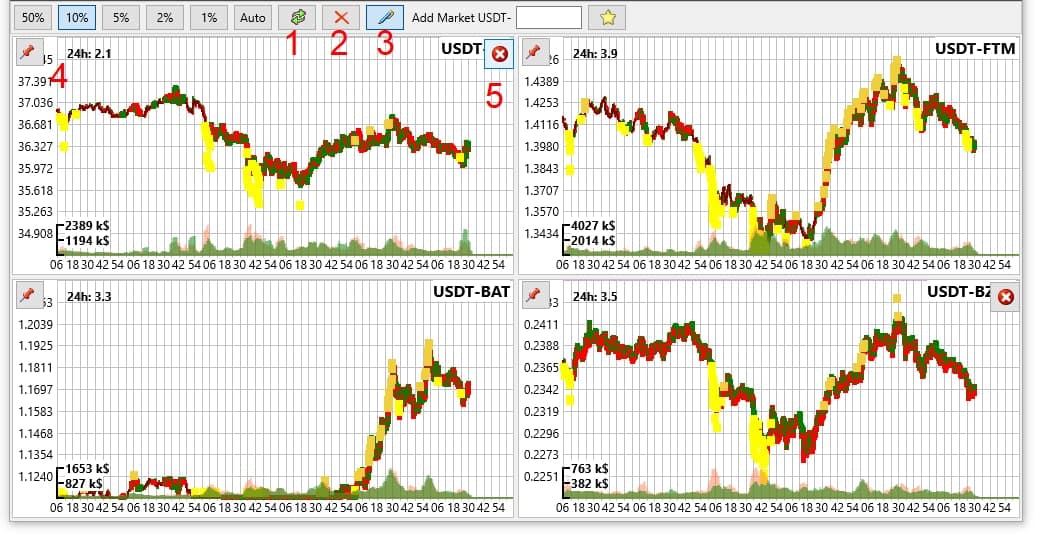
Button 1 (“refresh”): Reset the scale, center the graphs (and recalculate the cells, if the Auto Resize checkbox is off)
Button 2 (“clear”): Delete all charts from the active window
Button 3 (“information”): Allows to hide the price, time scales and other information, leaves only the tick chart
Button 4 (“Pin”): appears only when adding graphs automatically. If you press it, the chart remains forever, otherwise it is deleted after KeepInChart seconds.
Button 5 (“close”): Appears when you move the mouse to the right corner. Closes the chart.
If the “Separate control zones” checkbox is disabled in the general bot settings (Settings – Interface), you can manage existing orders on the mini-charts by dragging and dropping.
When you press shift + middle mouse button, the time scale is copied to all charts in the window (thus, you can stretch or shrink 1 chart, and by pressing the button simultaneously stretch the rest)