
"MOON SCALPER" ADDON
Full-screen chart update in real time
In your working chart, open to full screen, you will receive information about transactions instantly in real time. Orders in the orderbook are updated 2 times per second.
Market analysis tools
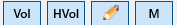
To turn on the tool, press its button.
To go to the advanced setup of the tool, press the right mouse button over its button.
VERTICAL VOLUMES (VOL BUTTON)
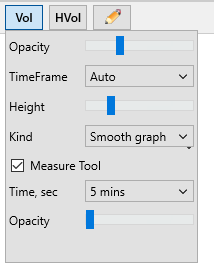
TimeFrame: set the volume measurement interval. The volume at each point in time is considered as the total volume in the given interval. The Buy and Sell Volumes, as well as the Total Volume, are considered separately.
Opacity: set the transparency of the display of volumes.
Height: sets the height of the volume display area (as a percentage of the total height of the chart).
Kind: Smooth Graph: with this display option, Sales (Red) are superimposed on top of the Purchases (Green). The total height of the volume bar is equal to the maximum of the Buy or the Sell Volume, accordingly, the prevailing volume will be displayed higher.
Kind: Stacked Graph: with this display option, Sales (Red) are drawn over Purchases (Green). The total height of the volume bar is equal to the sum of sales and purchases.
Measure Tool: allows you to measure buy and sell volumes at any interval of the chart, by selecting an area on it. If you check the box, an additional window for measurement results with BV and SV values will appear in the upper right corner of the chart. Hovering the mouse cursor over the desired part of the graph, you will see the traded volumes in this area.
Time, sec: The size of the zone to measure (for example, if you select 30 seconds, volumes are measured in the zone plus or minus 15 seconds from the cursor position)
Opacity: transparency.
HORIZONTAL VOLUMES OR MARKET PROFILE (HVOL BUTTON)
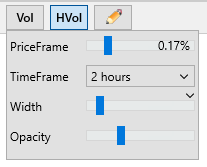
PriceFrame: price increment is set(Price Step). If 0%, the bot will measure the Buy and Sell Volumes at each price value (for example, 1000,1001,1002 and so on) if 1%, then it will measure volumes within the 1% price range (for example, 1000 prices will display the volume of transactions at prices from 995 to 1005).
TimeFrame: time measurement, maximum 48 hours. When choosing TimeFrame to 24h. volumes are calculated by trades, if more than 24 hours, then by candles.
Width: histogram width (as a percentage of the total width of the graph).
Opacity: transparency.
DRAWING PANEL
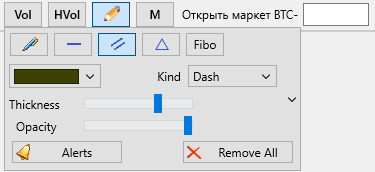
In this menu, you must click to select one of the tools:
Pen: free drawing.
Horizontal line.
Trend lines.
Triangle.
Fibonacci lines (level 0.618 is user-defined, you can drag this line by holding Ctrl and left mouse button)
You can also choose the thickness, line type, and transparency. In order to start drawing, you need to hold Ctrl on the graph and press the left mouse button to draw the desired element. In order to delete an item, you must press Ctrl + Z. If you want to change the drawing, hold Ctrl and move the course to the edge of the drawn element, you will be able to edit it. If you need to urgently turn off all the drawings, click on the button with the pencil icon to turn off the drawing layer.
ALERTS
Some chart figures can be turned into alert triggering objects. To do this draw a figure, right-click on any of its node (for a line click any place of this line, for a triangle click on the top of the triangle). In the drop-down menu tick the “Alert” item.
The figure will change its color. When the price crosses the figure, there will be a sound signal and the corresponding market button in the chart’s top panel.To see the list of all active alerts, click the “Alert” button in the drawing panel or the “Alert” menu in the main menu.
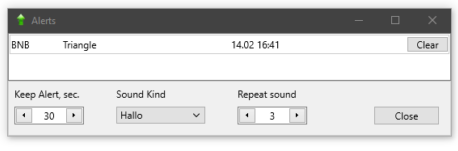
To open the market click on the coin in the list. To remove the alert (but not the figure itself) click the “Clear” button.
Settings:
Keep Alert: how long (in seconds) the market button should be kept in chart’s top panelRepeat sound: how many times to repeat sound signal (it is repeated once in 5 seconds)