Education
Here you will find all the knowledge and tools for confident trading in the
Moonbot terminal:
from understanding terms and strategies — to trade analysis and risk control.
Basic Indicators for Beginners
are mathematical calculations based on price and/or volume that help traders identify trends, determine entry and exit points, and assess the strength of a movement. However, indicators do not predict the future — they only interpret the past and present, helping traders make more informed decisions. For beginners, it’s important to start with a few simple and reliable tools instead of trying to use dozens of indicators at once.
1. Moving Averages and Their Application
is a line that smooths out price fluctuations, showing the average price of an asset over a given period. It’s the simplest and most universal indicator every beginner should master.
-
A Simple Moving Average (SMA) is calculated as the arithmetic mean of the closing prices over N periods. For example, SMA(20) is the average price over the last 20 candles.
-
An Exponential Moving Average (EMA) is considered a more responsive indicator compared to the simple moving average (SMA), though it may produce more false signals.
EMA is calculated using the formula:
EMA = Current_Price × k + Previous_EMA × (1 − k)
where k = 2 / (N + 1) is the smoothing coefficient, and N is the calculation period.
Example: for EMA(10), the coefficient k = 2 / (10 + 1) ≈ 0.18. This means the current price affects the indicator by approximately 18%, while previous values account for 82%.
💡 When it’s said that EMA gives more weight to recent data, it means that unlike SMA — where all periods are equally weighted — EMA places more emphasis on the latest prices (from the last few candles). As a result, it responds faster to changes in market dynamics and better reflects the current trend.
Practical Applications of Moving Averages:
-
Identifying the trend: the price’s position relative to a long-term moving average (e.g., MA(100) or MA(200)) helps determine the general trend. If the price is above the MA — an uptrend prevails; if below — a downtrend.
-
Dynamic support and resistance: in a strong trend, MAs often act as levels from which the price temporarily bounces before continuing in the trend’s direction.
-
Moving average crossovers: when a fast MA (with a shorter period, e.g., 20) crosses a slow MA (with a longer period, e.g., 50) from below, it’s a buy signal; crossing from above is a sell signal.
-
Popular periods: 20, 50, 100, 200 — the most commonly used values for analyzing short-, medium-, and long-term trends.
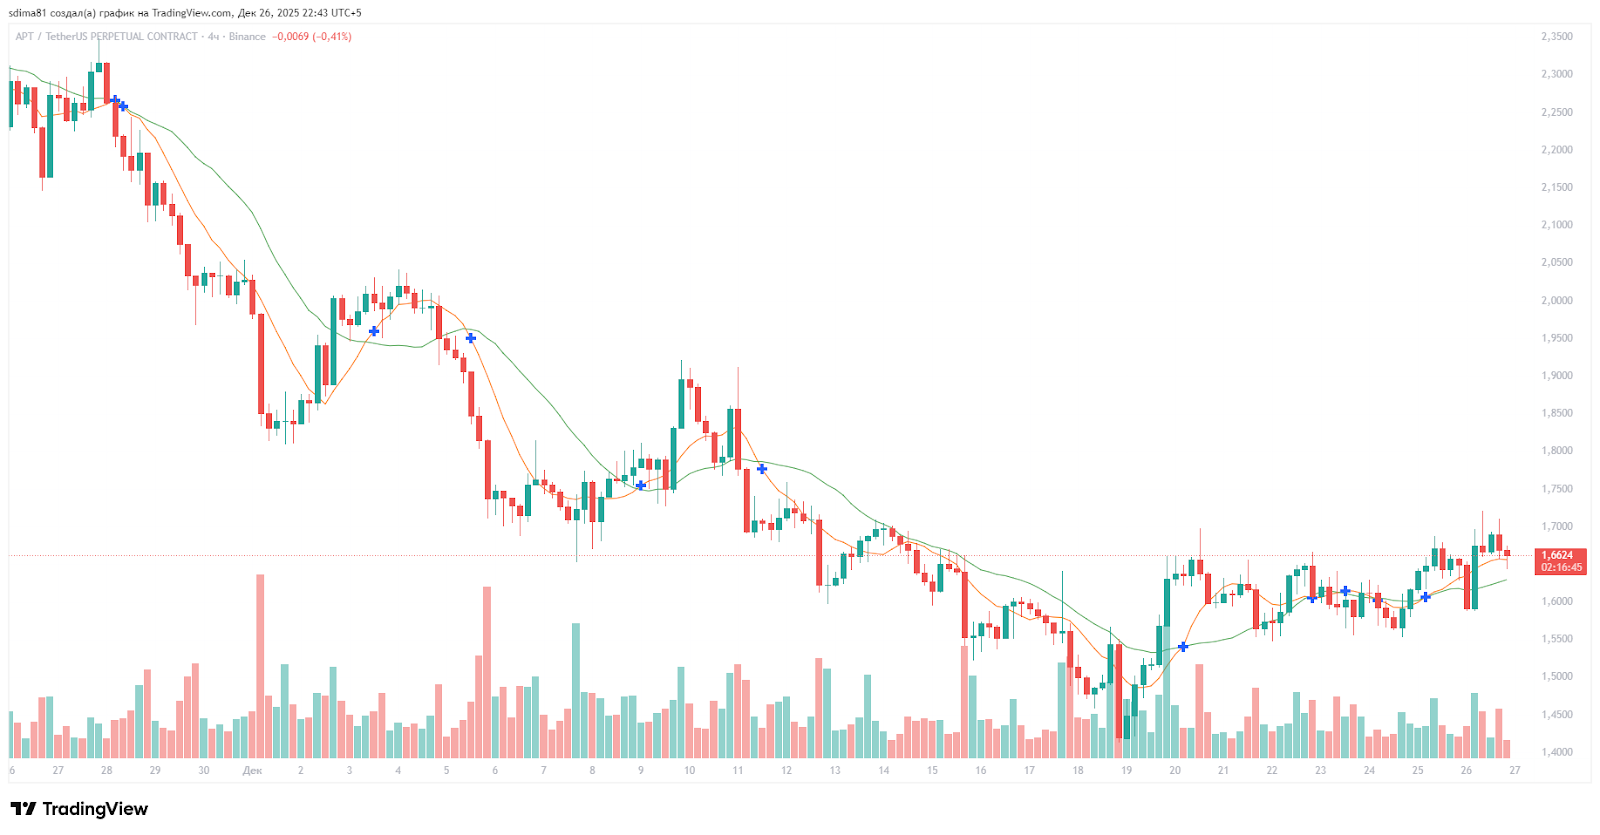
💡 To improve analysis reliability, traders often use multiple moving averages with different periods at the same time — this helps visualize both short-term and long-term trends and avoid false signals. An example of a chart with multiple moving averages is shown below.
2. Relative Strength Index (RSI)
is an oscillator that moves between 0 and 100 and measures the speed and magnitude of price changes. It helps identify when an asset is overbought (potential decline) or oversold (potential rise).
RSI is calculated using the formula:
RSI = 100 - (100 / (1 + RS))
where RS = Average Gain / Average Loss over N periods (usually 14).
Example: If over the past 14 candles the average gain was 2% and the average loss was 1%, then RS = 2/1 = 2, and RSI = 100 - (100 / (1+2)) = 66.7.
A value above 70 indicates overbought conditions (high buying activity, possible correction), while a value below 30 suggests oversold conditions (heavy selling, possible rebound).
Classic RSI levels:
-
Above 70 — overbought zone, potential downward pullback
-
Below 30 — oversold zone, potential upward rebound
-
50 — neutral zone separating bullish and bearish sentiment.
Practical applications of RSI:
-
Identifying reversals: buying in the oversold zone, selling in the overbought zone
-
Divergences: when price hits new highs but RSI doesn’t confirm — a sign of weakening trend
-
Signal confirmation: RSI above 50 confirms bullish bias, below 50 indicates bearish sentiment
-
Trade filtering: in an uptrend, look for buys when RSI is below 50; in a downtrend, sell when RSI is above 50.
3. MACD (Moving Average Convergence/Divergence)
helps identify the trend direction and strength of the current price momentum. It is based on the difference between two exponential moving averages — fast and slow — and includes a signal line, which is a smoothed version of this difference.
Key MACD components:
-
MACD line — the difference between the fast and slow EMA
-
Signal line — a smoothed version of the MACD line
-
Histogram — visual representation of the distance between the MACD line and the signal line.
How it works:
-
When the MACD line crosses the signal line from below, it indicates strengthening upward momentum
-
When the MACD line crosses the signal line from above, it signals weakening momentum or a possible downward reversal
-
An increasing histogram indicates growing momentum; a decreasing one shows slowing.
MACD helps filter out weak signals and confirm trend direction, especially when used together with moving averages or RSI.
4. Stochastic
helps identify potential reversal points and determine overbought and oversold market conditions. It compares the current closing price to the price range over a selected period and shows how close the price is to its recent highs or lows.
Key Stochastic components:
-
%K — the main indicator line
-
%D — the smoothed version of %K (signal line)
-
Levels 20 and 80 — conventional oversold and overbought thresholds.
How it works:
-
When %K and %D are below 20, the market is considered oversold; if %K crosses above %D from below, this may signal recovery
-
When the lines rise above 80, the market is considered overbought; if %K crosses below %D, it indicates a possible reversal or correction
-
Divergence between price movement and the indicator may indicate a weakening trend.
Stochastic is helpful for spotting entry points during pullbacks and works well as a confirmation tool alongside trend indicators like MA or MACD.
5. Bollinger Bands
helps assess current market volatility and identify potential price deviations from the average. The indicator consists of three lines based on a moving average and standard deviation.
Key Bollinger Bands components:
-
Middle band — typically a simple moving average (SMA)
-
Upper band — SMA plus two standard deviations
-
Lower band — SMA minus two standard deviations.
How it works:
-
Widening bands indicate rising volatility; narrowing bands suggest decreasing volatility
-
Price movement near the upper band increases the likelihood of a downward correction; near the lower band — potential rebound
-
Price breaking outside the bands can indicate strong momentum but often returns back into the range
-
The middle band is often used as a dynamic support or resistance level.
Bollinger Bands help visually assess market conditions, identify periods of high or low volatility, and confirm signals from other indicators such as MA or RSI.
Combining Indicators
Using multiple indicators simultaneously allows traders to receive more reliable trading signals. In practice, the most effective combinations involve one tool showing the trend, another showing momentum, and a third identifying potential entry points.
-
MA + RSI: A classic combination for signal filtering. Consider buying when the price is above the MA and RSI exits the oversold zone; selling — when the price is below the MA and RSI is in the overbought zone.
-
MA + MACD: Helps identify both trend direction and momentum strength. If MAs are sloping upward and MACD crosses the signal line from below, this strengthens the buy signal.
-
Stochastic + RSI: Used to refine entry points during pullbacks. If both indicators exit the oversold zone, the probability of a reversal is higher.
-
Bollinger Bands + MA: The MA shows the trend direction, while Bollinger Bands indicate current volatility levels. Buying makes sense when bouncing from the lower band in an uptrend, selling — from the upper band in a downtrend.
-
MACD + Bollinger Bands: Band expansion combined with a rising MACD histogram suggests increasing momentum and a greater likelihood of a breakout continuation.
-
Multiple timeframes: Use MA or Bollinger Bands on a higher timeframe to determine the overall trend, and RSI or Stochastic on a lower timeframe to pinpoint entry points.
-
Level confirmation: If a key support or resistance level aligns with the MA or Bollinger Band boundaries, and MACD or RSI confirm the direction, the signal is considered strong.
Limitations of Indicators
1. Lagging: all indicators are based on historical data and cannot predict sudden market changes.
Indicators always react to price changes with a delay, since they rely on past data. The longer the indicator period, the greater the lag. For example, with a moving average MA(N), the parameter N determines how many past candles are included.
If N is large (e.g., MA(50)), the indicator smooths fluctuations more but reacts slower. If N is small (e.g., MA(5)), the line stays closer to the price and changes faster, but becomes more "noisy".
Think of it this way:
-
MA(5) “looks” at the last 5 candles → reacts quickly → minimal lag.
-
MA(20) uses 20 candles → reacts slower → more lag.
-
MA(50) includes 50 candles → very smooth line → signal appears late.
Thus, lag increases with the period — the greater N, the later the indicator reflects a change in price direction.
2. False signals: in sideways markets, indicators often give conflicting signals. RSI can remain in extremes for a long time, and moving averages may generate many crossovers.
3. Over-optimization: trying to find the “perfect” indicator settings based on historical data rarely works in live trading.
4. Market condition dependency: Indicators that perform well in trending markets may be useless in sideways markets, and vice versa.
How to Avoid Overloading the Chart with Indicators
-
The Rule of Three: For reliable analysis, it’s recommended to use not just one, but several independent indicators. In practice, strong signals are formed when at least three indicators confirm the same price direction. Below are examples of popular indicators that are often combined:
-
MA(20) / MA(50) — helps determine the current trend direction and identify acceleration points during crossovers.
-
RSI — shows overbought or oversold conditions and helps filter false trend entries.
-
MACD — reflects momentum strength and confirms reversals or trend acceleration.
-
Stochastic — identifies local entry points during pullbacks.
-
Bollinger Bands — helps evaluate volatility and identify areas where price moves beyond statistically normal boundaries.Example: If MA(20) is sloping upward, MACD crosses the zero line from below, and RSI exits the oversold zone — such a combination is considered a more reliable buy signal than any single indicator on its own.
-
Different types: when using multiple indicators, choose from different categories (e.g., trend + oscillator) rather than several similar ones.
-
Price takes priority: Remember that price action is more important than indicators. If an indicator contradicts a clear price signal, trust the price.
-
Keep it simple: Start with one moving average and RSI. Master them completely before adding more tools.
How to Choose Suitable Indicators
The choice depends on your trading style and market conditions. For trend trading, moving averages are more suitable; for spotting reversals — oscillators work best.Beginners are advised to start with EMA(20) and RSI(14) — a universal combination for most situations.
Checklist for Working with Basic Indicators
1. Add a single moving average to the chart (EMA 20 is recommended)
2. Enable RSI with a 14-period setting in a separate window below the main chart
3. Determine the overall trend by the price’s position relative to the moving average
4. Use RSI to identify overbought/oversold zones
5. Look for divergences between price and RSI at key levels
6. Avoid entering trades against the main trend without strong justification
7. Confirm indicator signals with price action and volume analysis
8. Test indicator settings on historical data before applying them in live trading.
Common Mistakes When Using Indicators
-
Using too many indicators at once
-
Trading based solely on indicator signals without price analysis
-
Searching for the “Holy Grail” — the perfect indicator or setting
-
Ignoring the market context when interpreting signals
-
Frequently changing indicator settings without sufficient testing
-
Expecting indicators to work in all market conditions
-
Entering trades on the first signal without additional confirmation.
Technical indicators are useful tools — not magic wands. They work best in combination with price analysis, support/resistance levels, and market psychology.
Start with simple and reliable indicators, study them thoroughly, and only then move on to more advanced tools.
Remember: successful trading doesn’t depend on how many indicators you have on the chart, but on your understanding of the market and disciplined application of proven methods.