Education
Here you will find all the knowledge and tools for confident trading in the
Moonbot terminal:
from understanding terms and strategies — to trade analysis and risk control.
Major Chart Patterns in Technical Analysis
are recurring price formations on the chart that signal a potential continuation or reversal of the current trend. These patterns reflect mass psychology — periods of indecision, position accumulation, and the battle between buyers and sellers. Understanding chart patterns helps traders anticipate future price movements and make informed trading decisions.
Trend Continuation Patterns
These formations appear during temporary pauses in the main movement and typically signal that the trend will continue in the same direction once the pattern is completed.
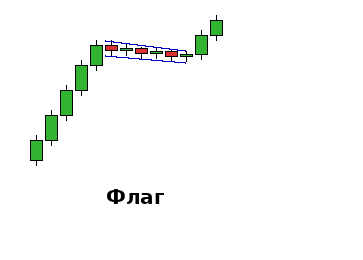
A rectangular formation that appears after a strong price movement (the flagpole). It represents a small consolidation moving in the opposite direction of the main trend. In an uptrend, the flag tilts downward; in a downtrend, it tilts upward. The breakout usually occurs in the direction of the initial move.
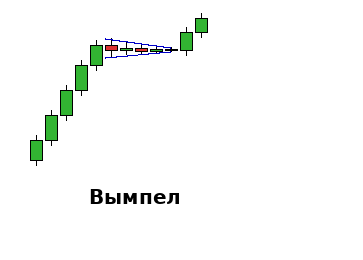
Similar to a flag, but shaped like a triangle with a narrowing range. It forms after a sharp move and signals a temporary pause before the trend continues. Volume typically declines during the formation of the pennant.
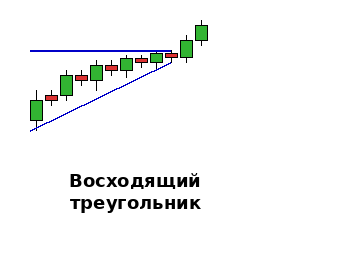
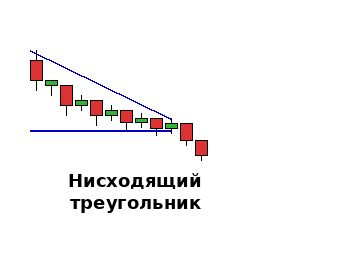
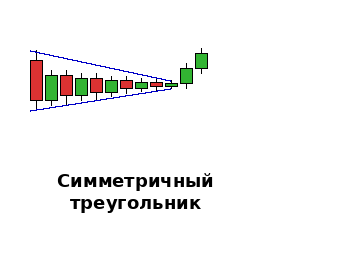
3. Triangles come in three types:
-
Ascending triangle — horizontal resistance above and rising support below. Usually breaked upward
-
Descending triangle — horizontal support below and descending resistance above. Often breaks downward
-
Symmetrical triangle — narrowing highs and rising lows form a symmetrical shape. The breakout direction depends on the prevailing trend.
Reversal Patterns
Reversal formations signal the end of a current trend and a possible change in the price direction.
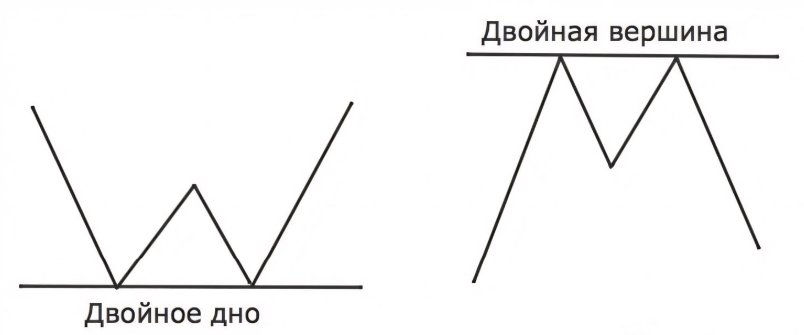
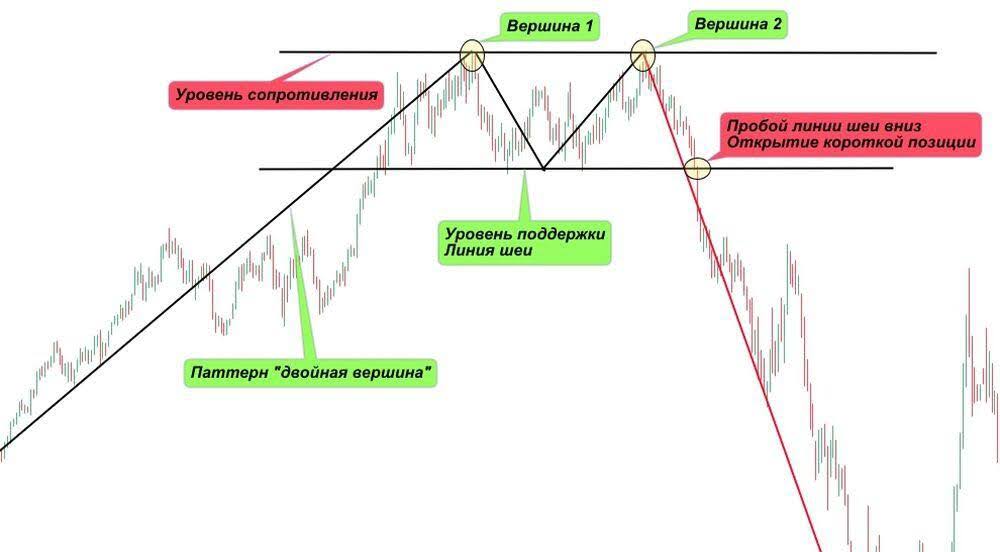
one of the most reliable reversal patterns.A double bottom forms at the end of a downtrend: the price tests the same support level twice but fails to break through. A double top is the mirror image at highs. The pattern is confirmed by the breakout of the "neckline" — the level between the two extremes.
a classic reversal pattern at the top of a trend.It consists of three peaks: the middle one (the head) is higher than the two side ones (the shoulders). The line connecting the lows between the head and shoulders is called the "neckline." A break of this line confirms a trend reversal to the downside.

a reversal pattern at the bottom of a downtrend, the mirror image of the classic head and shoulders.
a pattern where the price moves within a narrowing channel.
A rising wedge (sloping upward, both boundaries rising) usually breaks downward. A falling wedge (sloping downward, both boundaries falling) usually breaks upward.Wedges against the trend act as continuation patterns.
How to Trade Breakouts and Bounces from Patterns
-
Breakout trading: wait for a strong breakout beyond the pattern’s boundaries, ideally with increased volume. Enter after the breakout, with a target equal to the height of the pattern projected from the breakout point. Place your stop-loss inside the pattern, beyond the last significant extreme.
-
Bounce trading: in continuation patterns, you can trade bounces from boundaries before the pattern completes. Buy from the lower boundary of bullish patterns, sell from the upper boundary of bearish ones. This approach requires more experience and doesn’t apply to all pattern types.
-
False breakouts: not all breakouts lead to expected moves.
A false breakout occurs when the price briefly moves beyond the pattern’s boundary but quickly returns.
To protect against this, use a confirmation rule: wait for a candle to close beyond the pattern’s boundary.
Timeframes and Pattern Reliability
Patterns on higher timeframes (daily, weekly) are more reliable and produce stronger moves than those on lower timeframes (hourly, minute).
Formation time also matters: a pattern that develops over several weeks is stronger than one that forms in a few hours.
How to Choose an Appropriate Strategy for Chart Pattern Analysis
Beginner traders should focus on the simplest and most reliable patterns: triangles, flags, double bottom/top. Avoid trading complex formations until sufficient experience is gained. Always look for volume confirmation — breakouts on rising volume are more reliable.
Checklist for Chart Pattern Analysis
1. Identify the overall trend before the pattern forms
2. Classify the pattern: continuation or reversal
3. Mark key support and resistance levels within the pattern
4. Track volume dynamics during the formation
5. Calculate the potential target after the breakout
6. Define the entry point: breakout or bounce
7. Place a stop-loss considering a potential false breakout
8. Wait for confirmation via a candle close beyond the pattern boundary.
Common Mistakes in Pattern Trading
-
Entering a trade before the pattern is fully formed
-
Ignoring the overall trend when analyzing continuation patterns
-
Trading every suspected pattern without quality filtering
-
Placing stop-losses too close to the pattern’s boundaries
-
Neglecting volume analysis to confirm breakouts
-
Expecting textbook-perfect examples
-
Trading patterns on ultra-low timeframes without experience.
Lower timeframes (1–5 minutes) are more prone to random noise and situational events — a single large order can distort the pattern and create false signals. On low-liquidity assets, this issue is worse: a small group of traders can temporarily influence the trend.
For reliable pattern recognition, start with timeframes of 1 hour and above. -
Ignoring the possibility of false breakouts.
Chart patterns are a visual representation of market psychology and the balance of power among participants. They don’t guarantee success in every trade but significantly increase the probability of profitable entries when used correctly.
Start by studying basic patterns on daily charts, always consider market context, and remember: it’s better to skip a questionable pattern than to lose money on a false signal.