Education
Here you will find all the knowledge and tools for confident trading in the
Moonbot terminal:
from understanding terms and strategies — to trade analysis and risk control.
Japanese Candlesticks and Basic Candlestick Patterns
are not just a way to display price — they are the language of the market, telling the story of the ongoing battle between buyers and sellers. Each candle reflects the emotions of market participants: fear, greed, hesitation, or conviction. Studying candlestick patterns allows traders to "read" market sentiment and anticipate possible shifts in price dynamics.
Anatomy of a Japanese Candlestick
Each candlestick consists of three main elements:
-
The body — the rectangular area between the opening and closing prices. The color of the body indicates price direction: a green (or white) body means the price rose (closed above the open), while a red (or black) body indicates a drop (closed below the open). The size of the body reflects the strength of the move
-
The upper shadow (wick) — a thin line extending from the top of the body to the highest price of the period. It shows that the price reached higher levels but couldn’t hold and pulled back. The longer the upper shadow, the stronger the selling pressure — sellers prevented buyers from securing gains at higher prices.
-
The lower shadow — a line from the bottom of the body to the lowest price of the period. It represents how far the price dropped before recovering due to buying activity.
Long shadows indicate indecision and a tug-of-war between forces, while short shadows signal a confident move in one direction.
Simple Reversal Patterns
Bullish Reversal Candlestick Patterns
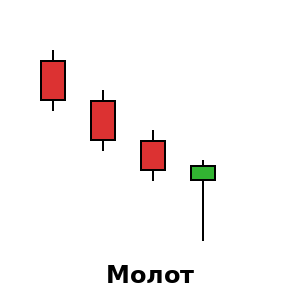
A candlestick with a small body at the top and a long lower shadow (2–3 times longer than the body). Appears at the end of a downtrend and signals a potential upward reversal. The long lower shadow shows that sellers pushed the price down, but buyers managed to bring it back to the opening levels.
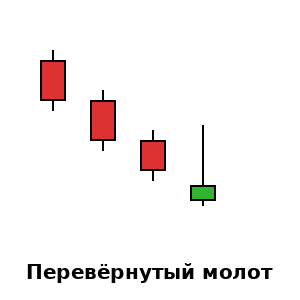
A candlestick with a small body at the bottom and a long upper shadow (2–3 times longer than the body). Appears at the end of a downtrend and signals a potential upward reversal. Buyers attempted to push the price higher, met resistance, but the very attempt indicates weakening seller pressure.
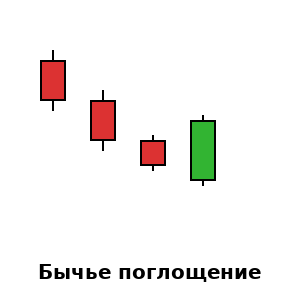
A two-candle pattern where the second candle fully “engulfs” the body of the previous one. Appears after a downtrend and signals a potential upward reversal. The first candle is red, and the second green candle opens below the first candle’s low and closes above its high — buyers have taken control from the sellers.
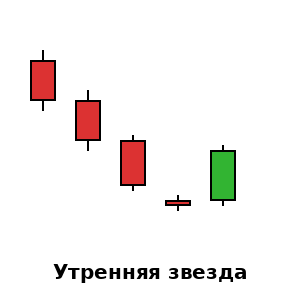
A three-candle pattern at the bottom of a downtrend. The first candle is a long-bodied red candle, the second is small (any color) with a downward gap (opens below the previous close), the third is a green candle closing above the midpoint of the first. Signals an upward reversal — the initiative shifts from sellers to buyers.
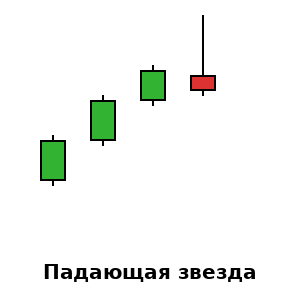
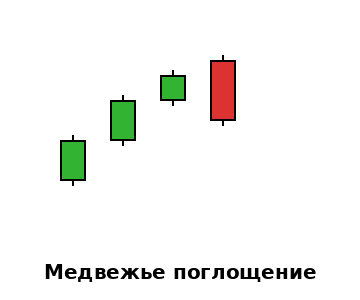
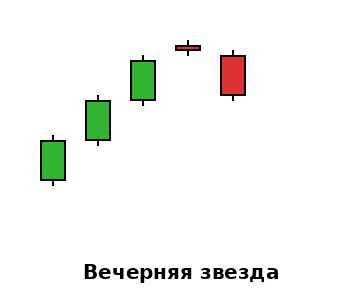
Bearish Reversal Candlestick Patterns
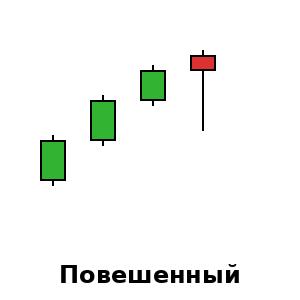
A candlestick with a small body at the top and a long lower shadow (2–3 times longer than the body). Visually identical to the Hammer but appears at the end of an uptrend and warns of a potential downward reversal. Despite closing near the highs, sellers showed notable activity during the period.
A candlestick with a small body at the bottom and a long upper shadow (2–3 times longer than the body). Appears at the end of an uptrend and signals a potential downward reversal. Buyers tried to push the price higher, but sellers rejected the move and returned the price to the opening level.
A two-candle pattern where the second candle fully “engulfs” the body of the previous one. Appears after an uptrend and signals a potential downward reversal. The first candle is green, the second is red — it opens above the first candle’s high and closes below its low — sellers have taken control from the buyers.
A three-candle pattern at the top of an uptrend. The first candle is a long-bodied green candle, the second is small (any color) with an upward gap (opens above the previous close), the third is a red candle closing below the midpoint of the first. Signals a downward reversal — the initiative shifts from buyers to sellers.
Trend Continuation Patterns
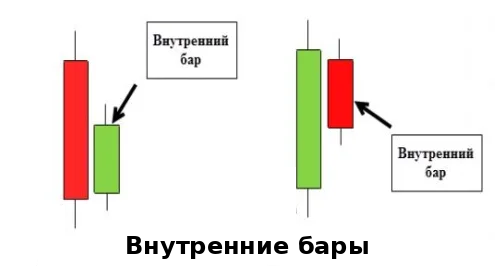
Candlesticks that are completely contained within the range of the previous candle (both the high and the low are lower than those of the parent candle). They indicate consolidation and accumulation of momentum for a potential continuation in the direction of the prevailing trend.
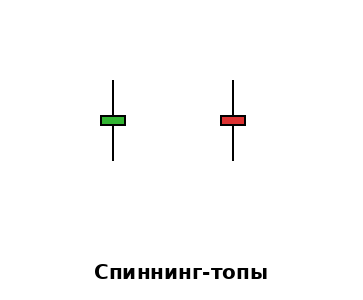
Candles with small bodies and long wicks on both sides, resembling tops. They reflect market indecision and a balance between buyers and sellers. In a trending market, they often precede a continuation of the trend after a brief pause.
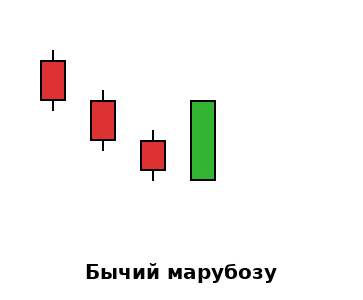
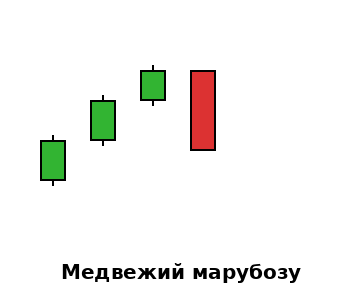
Candles with no or minimal wicks, where the opening price equals one extreme and the closing price equals the opposite extreme. A white Marubozu (open = low, close = high) indicates strong bullish sentiment, while a black one suggests bearish dominance.
Rules for Interpreting Candlestick Patterns
-
Context matters: the same candle can mean different things depending on where it appears — within a trend, at support/resistance levels, or after prolonged consolidation.
-
Confirmation by the next candle: reversal patterns require confirmation by the following candlesticks moving in the expected direction.
-
Volume strengthens the signal: candlestick patterns formed on higher volume are more reliable than those formed on low volume.
-
Timeframes: patterns on higher timeframes are stronger and have longer-lasting effects than those on lower ones.
How to Select Reliable Candlestick Signals
Beginner traders should focus on the simplest and most reliable patterns: hammer, engulfing, and morning/evening stars. Always look for these patterns near key support and resistance levels — they are most effective there. Avoid trading candlestick patterns in the middle of strong trends without additional confirmation.
Checklist for Analyzing Japanese Candles
1. Study the structure of the current candle: body size, shadow length, color
2. Determine what the candle reveals about the battle between buyers and sellers
3. Identify any forming candlestick patterns on the chart
4. Check the context: where the pattern appears relative to the trend and key levels
5. Wait for confirmation from subsequent candles before entering a trade
6. Observe trading volume during pattern formation
7. Place stop-losses beyond key levels, not just behind the signal candle
8. Start with simple patterns, gradually learning more complex combinations.
Common Mistakes When Using Candlestick Patterns
-
Trading every pattern without regard to context
-
Entering a trade before pattern confirmation by subsequent candles (fear of missing out often leads to premature and unprofitable entries)
-
Ignoring the overall trend direction when analyzing reversal patterns
-
Chasing complex patterns instead of focusing on simple and reliable ones
-
Placing stop-losses too close to the signal candle’s body
-
Relying on candlestick patterns from very low timeframes
-
Expecting perfect textbook examples to occur in real trading.
Japanese candlesticks are a powerful tool for analyzing market psychology. They don’t provide guaranteed signals, but they help better understand market sentiment and improve trading decisions. Start with basic patterns on higher timeframes, always look for confirmation, and remember: candles work best in combination with support and resistance levels.