“Markets Charts” Settings Area
“Markets Charts” Settings Area Overview
Colors Setup
The Colors Setup button opens the color settings window for various Moonbot interface elements, including charts, grids, orders, trades, volumes, order books, and more.
Main configuration parameters:
-
graphFont — font color for labels on the chart, and for 3h, 1h, and 15m volume values, and the horizontal volume histogram when TimeFrame: Max is selected
-
BuyOrder — color and transparency of long Buy orders
-
BuyPendingOrder — color and transparency of Pending orders
-
SellOrder — color and transparency of Sell orders for long positions
-
LastPrice — color and transparency of the average LastPrice line on the chart
-
graphBK — color and transparency of the chart background
-
graphNet — color of the chart grid; to make the grid fully transparent, move the transparency slider to the far left
-
graphCursor — color and transparency of the chart cursor and the outline of the horizontal volume zone; transparency can also be adjusted here
-
GraphRed — color of red trade crosses on the chart; also changes the color of the Sell volume (Sv) indicator; transparency can be adjusted here as well
-
GraphGreen — color of green trade crosses on the chart; also changes the color of the Buy volume (Bv) indicator; transparency can be adjusted here as well
-
VolRed — background color of the red order book; also changes the color of sell volumes (red) in both vertical and horizontal histograms; transparency can be adjusted here
-
VolGreen — background color of the green order book; also changes the color of buy volumes (green) in both vertical and horizontal histograms; transparency can be adjusted here
-
OrderBookRed — color and transparency of the red seller order book
-
OrderBookGreen — color and transparency of the green buyer order book
-
BookLevelRed — color and transparency of horizontal seller order lines
-
BookLevelGreen — color and transparency of horizontal buyer order lines
-
BuyOrderDone — color and transparency of orders that have been completed
-
Trailing — color and transparency of the trailing stop line
-
BuyShort — color and transparency of Buy orders for short positions
-
SellShort — color and transparency of Sell orders for short positions
-
SpotRed — color and transparency of red trade crosses on the spot market
-
SpotGreen — color and transparency of green trade crosses on the spot market
-
SpotBookRed — color and transparency of the red order book on the spot market
-
SpotBookGreen — color and transparency of the green order book on the spot market
-
MarkPrice — color and transparency of the mark price line
-
LiqPrice — color and transparency of the liquidation price line
-
LiqOrdersLong — color and transparency of long liquidation crosses (blue)
-
LiqOrdersShort — color and transparency of short liquidation crosses (yellow).
When trading on the futures market in the MoonBot terminal, yellow crosses may appear on the chart. These indicate short position liquidations occurring on Binance.
Additional color profile buttons:
-
Default — reset to default color scheme
-
Solarized — apply the Solarized color scheme
-
Soft — apply the Soft color scheme
-
Gentle — apply the Gentle color scheme.
Parameters changed in the Colors Setup window are saved to the MoonBot.ini file. To apply the same color scheme in another terminal, copy the MoonBot.ini file from the original folder to the new terminal folder after closing both terminals.
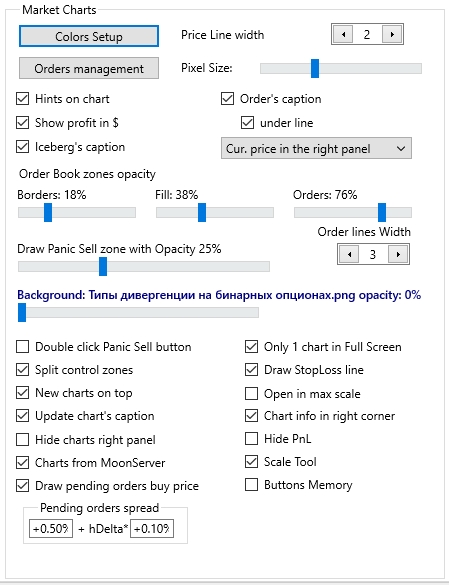
Price Line width
A slider to adjust the thickness of the current price line on the chart. It has five fixed positions, from 1 to 5.
Orders management
The Orders management button opens a separate window where you can configure hotkey combinations for placing and moving long, short, and pending orders.
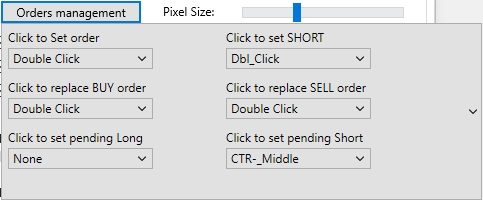
These settings are used when multi-order mode is not active in the MoonBot terminal.
If multi-order mode is active and the M button is pressed on the main screen, then long and short order placement and movement are controlled by the multi-order window settings.
Hotkeys for placing pending orders are always configured through the Orders management window, regardless of multi-order mode.
⚠️ Note! It is recommended to use different key combinations for different order actions.
Main key assignment options for order actions
✓ None — no combination
✓ Double Click — double left mouse click
✓ CTRL - Double Click — double click while holding CTRL
✓ Shift - Double Click — double click while holding Shift
✓ Alt - Double Click — double click while holding Alt
✓ Middle Click — single middle mouse button click (scroll wheel)
✓ CTRL_Middle — middle click while holding CTRL
✓ Shift_Middle — middle click while holding Shift
✓ Alt_Middle — middle click while holding Alt.
✓ None
✓ Dbl_Click
✓ CTRL_Click
✓ Shift_Click
✓ Alt_Click
✓ Middle-Click
✓ CTRL_Middle
✓ Shift_Middle
✓ Alt_Middle.
✓ None
✓ Double Click
✓ CTRL - Double Click
✓ Shift - Double Click
✓ ALT - Double Click
✓ Middle Click
✓ CTRL_Middle
✓ Shift_Middle
✓ Alt_Middle.
✓ None
✓ Double Click
✓ CTRL - Double Click
✓ SHIFT - Double Click
✓ ALT - Double Click
✓ Middle Click
✓ CTRL_Middle
✓ Shift_Middle
✓ Alt_Middle.
✓ None
✓ Double Click
✓ CTRL - Double Click
✓ SHIFT - Double Click
✓ ALT - Double Click.
✓ None
✓ Dbl_Click
✓ CTRL_Click
✓ Shift_Click
✓ Alt_Click
✓ Middle-Click
✓ CTRL_Middle
✓ Shift_Middle
✓ Alt_Middle.
✓ None — do nothing
✓ Parallel Shift to cursor — move the entire order grid to the cursor while preserving spacing
✓ Top Vol first — move the order with the highest volume
✓ Low Vol first — move the order with the lowest volume
✓ Top Profit first — move the order with the highest profit
✓ All to 1 price — move all orders to a single price (this may be the mode you currently have selected)
✓ Last Set — move the most recently placed order
✓ Last Moved — move the last order updated on the exchange by time.
Pixel Size
A slider with four fixed values that allows you to decrease or increase the size of trade crosses on the chart.
☐ Hints on chart
When this checkbox is enabled, floating tooltips will appear in the lower left corner of the chart with signal and order status updates. The information will smoothly scroll upward and fade out over time.
☐ Show profit in $
When this checkbox is enabled, the profit in dollars will be displayed in the orders list.
☐ Iceberg’s caption
When this checkbox is enabled, orders placed in Iceberg mode will display an [i] icon both on the chart and in the orders window.
☐ Order’s caption
When this checkbox is enabled, the order amount in dollars will be shown above the order line on the chart.
☐ under line
When this checkbox is enabled, the order amount in dollars will be shown below the order line on the chart.
Current price display options:
-
Cur. price in the right panel — the current coin price will be shown in the lower part of the right panel on MoonBot’s main window
-
Cur. price in the spread — the current coin price will be shown in the spread between ASK and BID on the main window
-
Don't show cur. price — the current coin price will not be displayed either in the right panel or the spread
Order Book zones opacity
Below are two separate sliders — Borders: XX% and Fill: XX% — which allow you to adjust the transparency of the order book boundaries and fill areas as desired.
Orders: XX% — a slider that controls the visibility of horizontal order lines in the order book. At 0%, lines are invisible; at 100%, they are fully visible.
Order lines Width — a slider that adjusts the thickness of order lines from 1 (thinnest) to 6 (thickest).
Draw Panic Sell zone with Opacity XX%
A slider that adjusts the transparency of the blue Panic Sell zone shown on the chart.
Background: def (click to change) opacity XX%
To set a custom background for all coin charts, click the label Background: def (click to change) opacity XX%, choose a file from your computer, and click Open. Background transparency can be adjusted using the slider below. To reposition the background on the chart, hold Shift and drag it with the left mouse button.
☐ Double click Panic Sell button
When this checkbox is enabled, a double-click on the Panic Sell button is required to activate it. This helps avoid accidental activation from a single click.
☐ Split control zones
When this checkbox is enabled, the control areas will be split: the chart control area will be on the left, and the order control area will be on the right.
☐ New charts on top
When this checkbox is enabled, newly opened charts will be placed above existing ones.
☐ Update chart’s caption
When this checkbox is enabled, the chart title will update with each new detector event. If the checkbox is disabled, the title will retain the first detected event.
☐ Hide charts right panel
When this checkbox is enabled, the right panel will be hidden to expand the chart area. This is especially useful on small screens or when running multiple terminals on one monitor. In the red order book area under the trading pair name, a button will appear: left-click — temporarily expands the panel, right-click — closes the coin chart.
☐ Charts from MoonServer
When this checkbox is enabled, charts will automatically load from Moonbot servers (if the paid Chart Loading module is active). If disabled, charts can still be loaded manually via the Menu on the main screen.
When this checkbox is enabled, a dashed line will appear near the solid pending order line, showing the price at which the real order will be placed once triggered.
Pending orders spread
Settings for the position of the dashed line relative to the solid pending line:
-
The left field sets a fixed percentage (positive — above, negative — below the pending line)
-
The right field sets an additional value based on the hourly delta of the coin.
Examples:
-
Left: 0%, Right: 0% — the dashed line will overlap the solid line. The real order will be placed exactly where the pending line was
-
Left: +0.5%, Right: 0% — the dashed line will be placed +0.5% above the solid line for all coins
-
Left: –0.5%, Right: 0% — the dashed line will be placed –0.5% below the solid line for all coins
-
Left: +0.5%, Right: +0.2% — for each coin, the dashed line will be above the solid line by the sum: [+0.5%] + (hDelta × [+0.2%]) For example: if hDelta = 10%, the dashed line will be at +2.5%
-
Left: –0.5%, Right: –0.2% — for each coin, the dashed line will be below the solid line by the sum: [–0.5%] + (hDelta × [–0.2%]) For example: if hDelta = 10%, the dashed line will be at –2.5%.
By combining values in these fields, you can adjust the dashed line position as needed.
☐ Only 1 Chart in Full Screen
When this checkbox is enabled, if your active chart is opened in full screen, the terminal will not open new charts over it when new signals are detected. Additionally, existing charts will not be shifted when a new signal chart is opened, provided your mouse cursor is in the order book area.
☐ Draw StopLoss line
When this checkbox is enabled, a stop-loss line will be displayed on the chart.
☐ Chat info in right corner
When this checkbox is enabled, new charts will open in a compressed view showing a 6-hour interval.
☐ Hide PnL (*futures only)
When this checkbox is enabled, PnL information will be hidden from the chart in futures mode.
☐ Scale Tool
When this checkbox is enabled, a percentage will be shown under the cursor line in the order book, indicating the distance between the spread and the cursor. A handy tool for evaluating distance to walls and measuring price drop or rise.
☐ Buttons Memory
When this checkbox is enabled, Buttons Memory functionality activates, used during manual trading.
Moonbot will remember the selected Buy and Sell button settings for each specific coin.
Once this is enabled, an additional Reset Buttons option appears in the main menu. It resets button settings and applies the most recently changed ones across all coins.
To avoid confusion, you can close all charts, set the desired buttons, then press Reset Buttons — all new charts will open using those settings.
You can enable or disable Buttons Memory without restarting MoonBot. The button memory data is saved in the file: data\USDT-MarketData.zip (example for the USDT pair), inside each coin’s archive.