Main Terminal Window with Advanced Settings
Monitoring Charts in Separate Windows
This feature allows creating separate windows to monitor coin charts and track their movement. Charts can be added to these windows either manually or automatically.
Window size, layout, number of charts to load, and other settings can be flexibly configured by the user.
The Moonbot terminal allows creating dedicated chart monitoring windows to track various trading scenarios. For example, you can set up separate windows to display general strategy detectors, specific strategy detectors, or specific trading events like "strong coin drop", "strong coin pump", "volume spike", and other parameters available in strategy settings.
This module is available to participants of the MoonBonusprogram. You can review the participation conditions by clicking the MoonBonusbutton at the top of the Moonbot main window.
Chart Monitoring Module Settings in Separate Windows
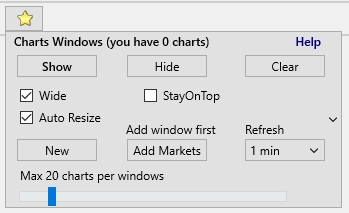
To open the settings for the chart monitoring module in separate windows, right-click the "Yellow Star"(Show favorite markets) button on the main Moonbot window, located to the right of the coin input field. This opens a separate settings menu:
Show button — displays previously created chart windows
Hide button — hides all chart windows (window state is preserved after restarting the terminal)
Clear button — clears and deletes all chart windows
New button — adds a new chart window
Add Markets button — copies all charts from the main Moonbot window into the active chart window. The active window is the one you've clicked on. Its number is shown above the Add Markets button
Refresh menu — sets the interval for auto-centering chart windows. Available intervals: 5 seconds, 15 seconds, 30 seconds, 1 minute, 5 minutes, 15 minutes
Wide checkbox — controls how chart cells are arranged. If unchecked, a square NxN table is created. If checked, a 16:9 ratio layout is used when possible
Auto Resize checkbox — enables automatic recalculation of cells when charts are removed. If checked, the table resizes automatically after manually deleting charts. If unchecked, resizing occurs only after clicking the green arrow "Refresh" button
StayOnTop — keeps the chart windows always on top
Max N charts per window — slider limiting the maximum number of charts loaded into one window.
How Charts Are Added to Monitoring Windows in Moonbot
Charts can be added to monitoring windows in Moonbot both manually and automatically.
Manual methodsfor adding charts to monitoring windows include:
Using the "Yellow Star" (Show favorite markets) button
Entering the coin name into the search field
Clicking the Eye icon to the right of a chart in the main Moonbot window
Right-clicking the market name next to the chart in the main Moonbot window
Automatic chart addition to monitoring windows is performed using detector strategies or when a purchase is executed by a MoonShot strategy.
To achieve this, the strategies use the following parameters:
AddToChart — chart window number where the coin chart will be added when the strategy triggers
KeepInChart — time in seconds the chart will remain in the window
When a chart is added automatically, a Pinbutton appears in the top-left corner of the chart. Clicking it removes the icon and pins the chart in the window permanently. If not clicked, the chart will be removed after the time specified in KeepInChart.
Charts without the Pinicon can be rearranged manually by dragging them with the Shiftkey held down — both within a window and between windows of the same Moonbot terminal.
More details about this module are available here: 🔗https://moon-bot.com/ru/charts-in-separate-windows/.
Question: I want to sort coins by, for example, the 15-minute delta and load all selected coins into a separate chart window. Can I do that? Answer: Yes, you can. To do this, create a new chart window or select an existing one with number N. Then in the main Moonbot window, click Show Markets, open the MarketsTable, click the column name 15m Deltato sort coins by the highest 15-minute delta. Move the cursor to the lowest coin in the desired range, right-click it. In the menu that appears, select Add markets above to Chart N (add the above-listed markets to the chart window number N) and click on it. The selected charts will immediately open in the specified chart monitoring window.
Informational Labels on the Chart
The price scale is located to the left of the chart, and the time scale is at the bottom. If you place the cursor over the chart and scroll the mouse wheel toward yourself, the chart will zoom out to the maximum time range, allowing you to view up to 6 hours of history. If you place the cursor over the chart and scroll the mouse wheel away from yourself, the chart will zoom in to the maximum, allowing you to view up to 1 minute of history. If you place the cursor over the chart, hold down Shift + Ctrl, and scroll the mouse wheel away from yourself, the chart will zoom in even further, showing up to 15 seconds of history.
In the top-left corner of the main chart, you’ll see the following values:
Spot — price deviation percentage between futures and spot (can be positive or negative)
F — funding rate percentage (can be positive or negative)
Time — time remaining until the end of the current funding cycle (hh:mm:ss)
These three parameters are available only in futures terminals.
Also displayed (on both spot and futures terminals):
24h (24h Delta) — 24-hour price change delta
P1h (Pump1h) — 1-hour price pump delta (difference between price 1 hour ago and the highest price during that hour, always positive)
D1h (Dump1h) — 1-hour price drop delta (difference between price 1 hour ago and the lowest price during that hour, always positive)
5m Delta (5m) — 5-minute price delta
1m Delta (1M) — 1-minute price delta
Max — maximum percentage price growth from the entry point
Session — the total session value for the coin. A red value indicates a loss, and a green value indicates a profit from trading this coin. The session includes all trades made both manually and automatically. You can reset the value via the Reset Session menu or by using the Telegram command ResetSession COIN (to reset the session for a specific coin) or ResetSession ALL (to reset sessions for all coins).
PNL (Pnl) — PNL value for the coin (futures only)
Open — the total amount of open orders in USD, as well as the current state of the entire position: loss (in red) or profit (in green), shown in both USD and percentage. If only a limit Buy order is placed in the Order Book, the position is not considered open. A position is considered open after the coin is bought. When a second order is added, the position size increases. Profit and loss indicators change in real time depending on price movement
MinuteVolDelta (Vd) — 1-minute volume delta (last 1-minute volume vs average over last 3 hours)
HourlyVolFast (Vf) — hourly volume with fast updates by trades
If the right panel is hidden via Settings → User Interface →the Hide charts right panel checkbox, 3h (3 hours), 1h (1 hours), and 15m (15 minutes) deltas are duplicated in the top-left of the coin chart.
BV_SV indicators(BuyVolume and SellVolume) are also displayed on the chart:
Stationary BV_SV indicator — measures volumes from the current moment to a historical event, based on time or trade count. Available intervals:
Pump Mode (from start) — from the beginning of trading on the coin
1 Minute
3 Minutes
5 Minutes
15 Minutes
30 Minutes
N Trades — last N trades
N Minutes — last N minutes
Set N — custom value for N (e.g., from 1 to 1440 minutes)
For example, selecting 30 Minuteswill display volume measurements for the last 30 minutes, showing buy and sell volumes and the balance of power using green and red indicators. If green is larger, buyers dominated; if red — sellers.
If you set 600and choose N Trades, the indicator will show data for the last 600 trades. Choosing N Minuteswill display data for the last 600 minutes.
Custom BV_SV indicator — measures Bv (Buy volume) and Sv (Sell volume) over any chart interval using the volume ruler. To activate it, right-click the Vol button, check Measure Tool, and enable the Bv_Sv ruler. This adds a second Bv_Sv indicator to the chart, showing Bv with a green bar, Sv with a red bar, and L — liquidation volume for the selected interval. In the Time sec menu, you can choose the measurement interval: Auto, 2, 5, 15, 30 seconds, or 1, 3, 5, 15, 30, 60 minutes. The ruler’s transparency is controlled by the Opacity setting.
Indicator positioning on the chart can be configured in Settings →User Interfaceusing the checkbox Chert info in right corner. If enabled, indicators appear on the right; if disabled — on the left.