Main Terminal Window with Advanced Settings
"Pencil" Button
The Pencil button is used to activate drawing tools on the chart.
This button and its related features are available only to PRO version users of Moonbot with the MoonScalper module activated.
Drawing tools allow traders to freely add elements to the chart, set support and resistance lines, apply Fibonacci levels, measure price volatility percentages and enable tracing of Buy and Sell orders.
When the button is active, you can draw on the chart and see all added elements. When the button is disabled, the drawn lines are hidden from view.
Right-clicking Pencil opens an additional menu with tool and settings options.
From this menu, you can select one of the available tools. Then, to draw on the chart, hold Ctrland draw the desired element by holding the left mouse button.
To undo the last drawn elements, press Ctrl+Z. To delete a specific element, right-click it and select Remove. To remove all elements from the chart, click Clear All in the selected drawing tool’s menu.
To change position of a drawn element, hold Ctrl, hover the cursor over its node (point, line, level), and you’ll be able to move or edit it.
Pen — a free drawing tool. With the Emulator option disabled, you can draw arbitrary lines on the chart.
If Emulator is enabled, an additional function becomes available: Draw with price line. This option is only available to participants of the MoonBonus program. When using this mode, it’s recommended to temporarily switch the terminal to emulator mode via Menu → Emulator mode.
For smoother drawing, zoom out the chart by scrolling the mouse wheel away from you and disable the AutoShift chart (OFF) button (blue arrow). Then, shift the chart to the left so there is space on the right side for drawing.
Next, press and hold CTRL, and draw the desired path to the right of the current price, leaving space before any active trades. When the live price line reaches the start of the drawn path, small crosses will begin moving along the drawn trajectory, emulating the defined price pattern. This allows you to test how strategies behave — including condition checks, Buy and Sell order placement, trigger responses, trailing, stop execution and other parameters.
For more accurate drawing, use coins with dense, active trading — like BTC — so that the emulated price line appears continuous and without large gaps.
To simulate a sudden price spike or drop, place a dot or short line below (or above) the current price — the chart will sharply move to that level.
To reset the emulated price path, use Menu → Reload charts (if the chart loading module is active), or press a hotkey configured in the Reload Chart field under Settings → Hotkeys.
If you don’t have the chart loading module connected, it’s recommended to experiment with the price line drawing on a separate terminal so that price deltas don’t affect strategies during live trading.
Infinite Horizontal Line
This tool is convenient for marking key support and resistance levels, as well as price boundaries. To place the line, press CTRL and click the desired spot on the chart. The line will appear with the exact price shown on the left.
You can use these lines to mark the chart by highlighting:
-
The highest and lowest price
-
Levels with large limit orders
-
Peaks of horizontal volumes.
This kind of markup helps identify important levels for current trading. If price highs or lows are updated, the lines can be moved or redrawn.
Custom Diagonal Line (Trend Line)
These lines are often used to represent sloped levels, where a breakout typically results in a strong upward or downward move.
To change the line's angle:
-
Hover the cursor over the beginning or end of the line while holding CTRL
-
Locate the key element at the line’s end
-
Hold the left mouse button and drag the element in the desired direction to adjust the line’s angle.
Triangle
This element is used to highlight price movement forming a triangle pattern for the purpose of forecasting the potential future price movement.
To adjust the triangle’s shape:
-
Hover over any vertex while holding CTRL
-
Locate the key element at the triangle’s corner
-
Hold the left mouse button and drag it to reshape the triangle.
Fibonacci Levels
The 0.618 level is customizable — you can move it by holding CTRL and dragging with the left mouse button.
Fibonacci levels are commonly used on larger timeframes (e.g., in TradingView) to identify strong levels, but they can also be helpful on short scalping intervals if price movements follow similar patterns. Key Fibonacci levels can be color-coded and their transparency adjusted.
Rectangle
This is a dual-purpose drawing element. In one mode, it works like an infinite horizontal line with price display. When stretched, it becomes a rectangular area showing the percentage of price growth (top-left) or decline (bottom-left).
In line mode, it is convenient to use it just like a horizontal line to mark support and resistance levels. When stretched, it can be used as a measuring tool to evaluate custom volatility and calculate percentage price changes.
To adjust rectangle boundaries:
-
Hover over the top or bottom edge while holding CTRL
-
Hold the left mouse button and drag it upward or downward to resize.
You can quickly cycle through the main drawing tools — Straight Line, Trend Line, Rectangle — using hotkeys configured in the Switch Chart Figure field under Settings → Hotkeys. While holding Ctrl, the Pencil icon will change to show the currently active drawing tool.
Trace
The Trace tool allows you to display the paths of Buy and Sell orders as well as Stop Loss lines, so you can track their movement over time. These traces help analyze strategy logic faster and adjust parameters on the fly without needing to dig into logs.
You can use the Opacity slider to adjust the trace transparency. To completely hide traces from the charts, move the slider all the way to the left. The Trace Clear button clears traces for the selected coin whose chart is currently in full-screen view.
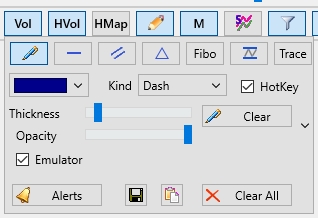
For each drawing element, you can configure:
-
Line color — using the color palette
-
Kind — line style: Solid, Dash, Dot, DashDot, DashDotDot
-
Thickness — line thickness
-
Opacity — line transparency.
-
The Clear button with the drawing tool icon allows you to clear all such elements on the chart of the currently selected coin.
This allows you to customize drawing elements so that they don’t clutter the chart and instead help you during trading.
For some shapes (lines, triangles, Fibonacci levels, rectangles), you can enable Alerts — sound notifications that trigger whenever the price crosses the selected shape, from either direction (above or below).
To enable an alert draw a shape, right-click on one of its nodes (for a line — anywhere on the line; for a triangle — on one of the corners), then select Alert in the dropdown menu.
Once the alert is enabled, the shape will change color, indicating that it now has a notification signal attached. The terminal will monitor the price in that area and play a sound when the price touches or crosses the shape. Additionally, a button with the coin name will appear in the upper-right panel. Clicking it opens the chart of the coin where the alert was triggered.
To disable the alert, open the same menu and uncheck the Alert option.
To delete the drawing element completely, right-click it and select Remove.
You can view the list of all active alerts by clicking the Alerts button on the drawing panel or by selecting the Alerts option from the main menu. In the window that opens, all alerts will be displayed along with the coins they are set on, the drawing elements they are linked to, the alert duration, sound notification settings and repeat count. You can also click on a coin name to instantly open its chart. Use the Clear buttons to remove alerts from drawing elements — the elements themselves will remain on the charts.
Moonbot terminal includes an autosave feature for all drawing elements on coin charts. These are saved to archive files such as USDT-ChartFigures.zip, USDT-ChartFigures-1.zip, USDT-ChartFigures-2.zip (for USDT pairs). These files are stored in the bak folder.
You can also manually save drawing elements. To do so, right-click the Pencil icon in the main window, and in the drawing tools menu, select the “Floppy Disk” icon. Then choose a folder and click Save.
To load previously saved drawing elements, click the icon located to the right of the “Floppy Disk” icon. In the file explorer, select the desired file and click Open. After that all saved elements will then be loaded into Moonbot. If you had drawn new elements before loading, the saved ones will be added to the existing ones on the chart.
By default, the order placement and movement mode is set in Settings → User Interface → Orders management. Here, you can configure how Buy orders are placed (for both long and short), assign mouse and keyboard combinations for order movement and set up delayed order placement. The following click types and key combinations are available in this menu:
-
Click to place order (None, Double Click, CTRL - Double Click, SHIFT - Double Click, ALT - Double Click, Middle Click, CTRL_Middle, Shift_Middle, Alt_Middle)
-
Click to set SHORT (None, Dbl_Click, CTRL_Click, Shift_Click, Alt_Click, Middle-Click, CTRL_Middle, Shift_Middle, Alt_Middle)
-
Click to move BUY order (None, Double Click, CTRL - Double Click, SHIFT - Double Click, ALT - Double Click, Middle Click, CTRL_Middle, Shift_Middle, Alt_Middle)
-
Click to move SELL order (None, Double Click, CTRL - Double Click, SHIFT - Double Click, ALT - Double Click, Middle Click, CTRL_Middle, Shift_Middle, Alt_Middle)
-
Click for delayed Long order (None, Double Click, CTRL - Double Click, ALT - Double Click)
-
Click for delayed Short order (None, Dbl_Click, CTRL_Click, Shift_Click, Alt_Click, Middle-Click, CTRL_Middle, Shift_Middle, Alt_Middle).